



Evaluate Therapeutic Response
See how the tumor microenvironment shapes treatment response
Assess anti-tumor activity in multicellular 3D tumor models
Therapies that look potent on tumor cells alone can lose activity in the presence of stroma, ECM, or immune suppression. The TME-Chip allows anti-tumor activity of different therapeutic modalities to be tested in 3D tumor models that include stromal and immune cells. Readouts include tumor growth inhibition, cell viability, and immune cell–mediated cytotoxicity.
Cytotoxic Chemotherapy and Targeted Small-Molecule Therapies
Benchmark standard-of-care agents and pathway-targeted agents in a 3D microenvironment.
Chemotherapy is the backbone of many standard regimens and the usual reference arm in efficacy studies. Targeted agents such as kinase inhibitors act on specific oncogenic pathways, but their activity can be shaped by the microenvironment. On the TME-Chip, dose–response, viability, and tumor growth inhibition can be compared in tumor-only and co-culture models, providing a reference for evaluating new agents and combinations. As an example, perfused gemcitabine increased cell death in BxPC-3 spheroids, visualized by DRAQ7 staining.
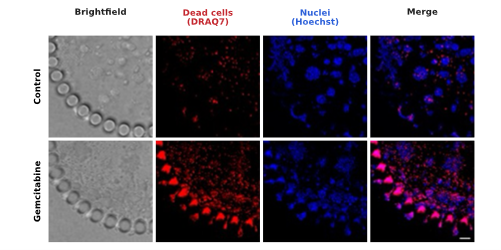
Perfused gemcitabine increases cell death in BxPC-3 spheroids on the TME-Chip.
BxPC-3 spheroids were treated with vehicle (Control) or gemcitabine and labeled with DRAQ7 (dead cells; red) and Hoechst (nuclei; blue). DRAQ7 signal was found higher after gemcitabine treatment, notably on the spheroid periphery. Scale bar, 100 µm.
As a further example, concentrations of pemetrexed that killed A549 cells in 2D monoculture did not induce cell death in A549–MRC-5 co-culture on the TME-Chip, consistent with the lack of response in an A549 xenograft model. This highlights the potential of conventional 2D assays to overestimate drug efficacy and the value of 3D co-culture models in assessing microenvironment-associated reductions in drug sensitivity.
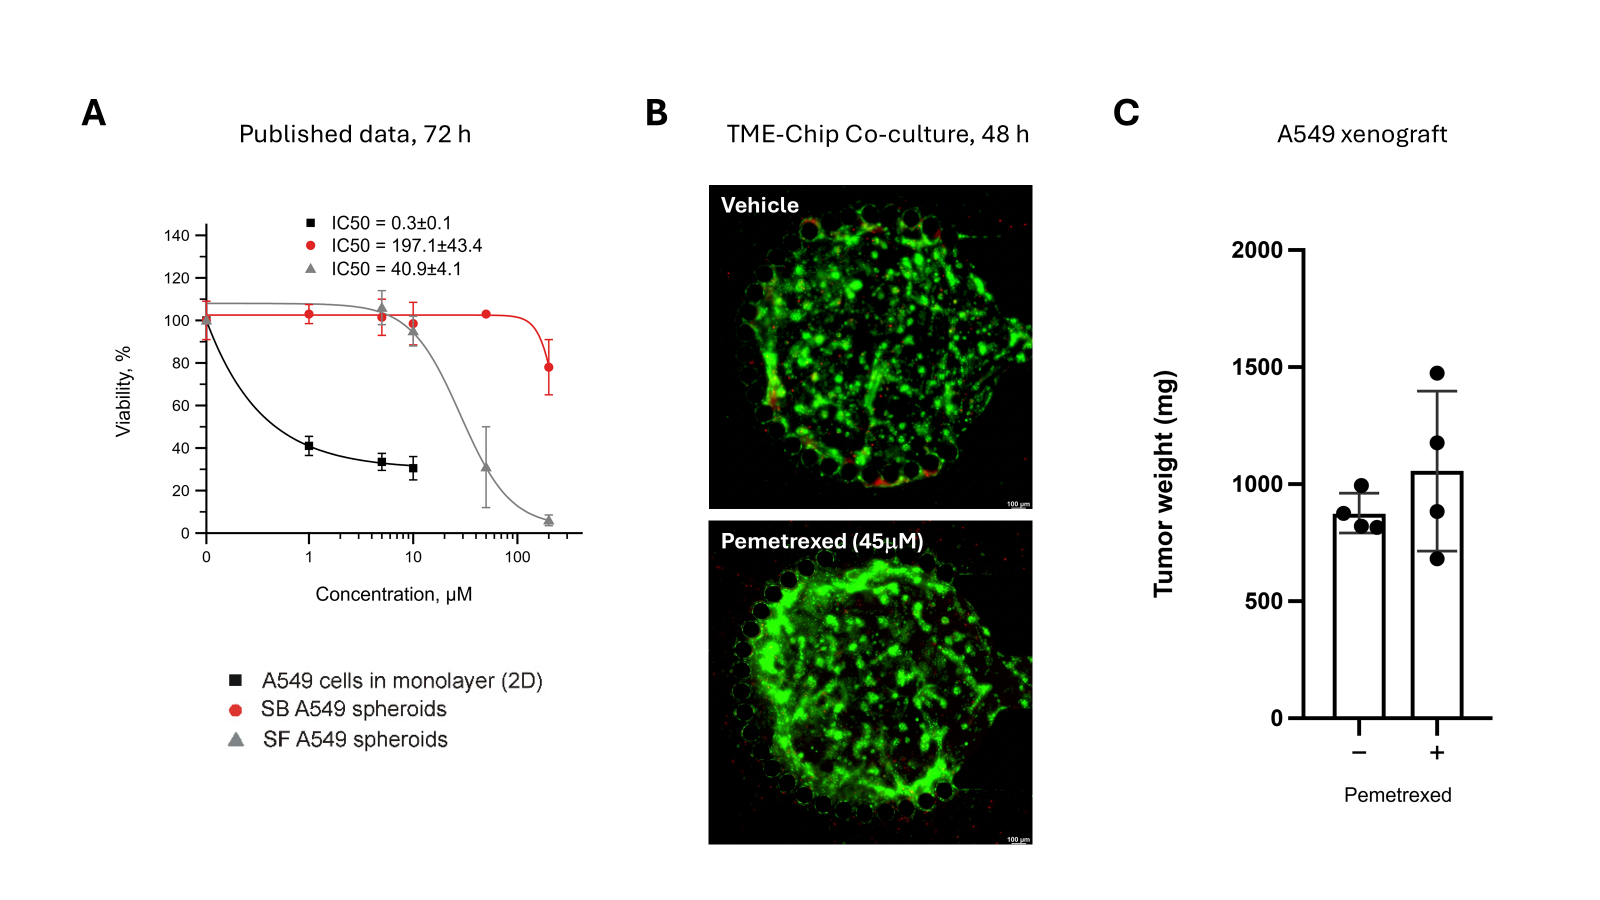
A549–MRC-5 co-culture on the TME-Chip is consistent with the lack of pemetrexed response seen in an A549 xenograft model, and in contrast to 2D culture.
(A) Published viability of A549 cells cultured as 2D monolayer or as monoculture spheroids (scaffold-free and scaffold-based) after 72 h of pemetrexed exposure (Data redrawn from Qi et al., Int. J. Mol. Sci. 2022, 23, 13306,
https://doi.org/10.3390/ijms232113306
; CC BY 4.0,
https://creativecommons.org/licenses/by/4.0/ ; mean ± SD). (B) Representative fluorescent images of A549-GFP and MRC-5 co-culture on the TME-Chip after 48 h of treatment with vehicle or pemetrexed (45 µM). Dead cells were labeled with DRAQ7; no significant difference was observed between conditions. Scale bar, 100 µm. (C) Pemetrexed did not significantly reduce tumor weight in an A549 xenograft model (n = 3 [control] and n = 4 [pemetrexed] ; mean ± SD).
Antibody-Based Therapies
Link therapeutic activity with target expression and tissue penetration.
The efficacy of antibody-based therapeutics depends on target expression and tissue penetration, and, for ADCs, payload delivery within the tumor tissue. On the TME-Chip, tumor cell killing and growth inhibition can be measured alongside distribution imaging (see Assess Drug Penetration and Distribution), allowing comparisons of therapeutic candidates, formats, or dosing regimens within the same model.
Immune Checkpoint Inhibitors and T-Cell Engagers
Test how immunotherapies change immune-cell access to and activity against tumor cells.
Checkpoint inhibitors and T-cell engagers work through immune cells, so testing them needs a model that includes them. With tumor and immune cells co-cultured in a 3D matrix on the TME-Chip, immune-cell infiltration and cytotoxicity can be measured after treatment, and effluent can be analyzed for cytokines and other secreted factors. As an example, in an A549–Jurkat co-culture, the anti-PD-L1 antibody atezolizumab increased T-cell infiltration into tumor tissue after 48 h.
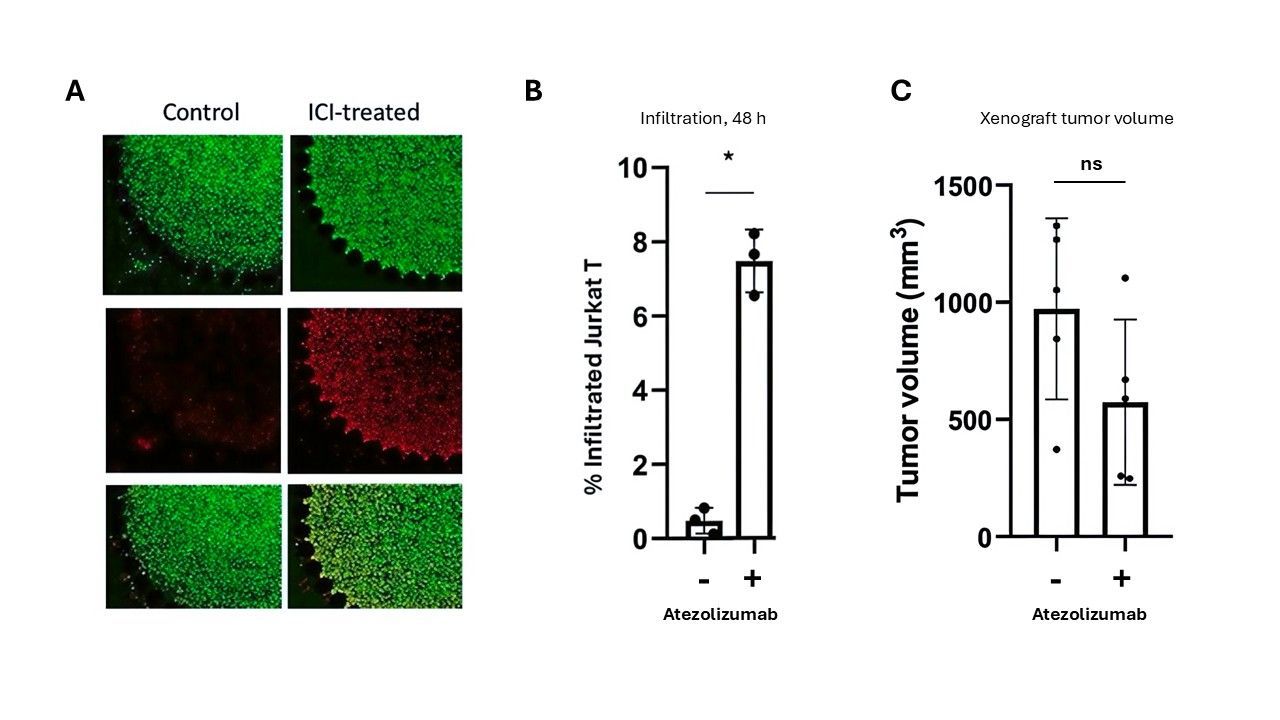
TME-Chip detects atezolizumab-induced T-cell infiltration, an early readout of checkpoint inhibitor activity.
(A) Representative images of A549 lung cancer cells (green) embedded in Matrigel in the tumor compartment of the TME-Chip; Jurkat T cells (red) were added with or without the anti-PD-L1 antibody atezolizumab through the side channel. (B) After 48 h, increased infiltration of Jurkat T cells was seen in the atezolizumab group. (C) For context, tumor volume in a separate A549 xenograft study with human PBMCs. Mean tumor volume was lower with atezolizumab, but the difference was not statistically significant (n = 5 [control] and n = 4 [atezolizumab-treated]; mean ± SD).
Cell Therapies
Examine how engineered and adoptive cell products infiltrate and act on tumor tissue.
In solid tumors, CAR-T, TCR-T, TIL, and NK cell products must reach the tumor, infiltrate it, and stay active in an immunosuppressive microenvironment. In the TME-Chip, their migration into 3D tumor tissue and tumor cell killing can be followed by imaging, and product variants, effector-to-target ratios, or combinations with other agents can be compared within the same model.
Combination Regimens
Screen combinations where microenvironment interactions shape the outcome.
Many combination strategies pair stroma- or immune-modulating agents with cytotoxic, targeted, or immune therapies to overcome barriers in the microenvironment. Single agents and combinations can be tested in parallel on the TME-Chip to identify combinations for further study.
Contact Us
Connect with Pythia Biotech to learn more about our products and services,
explore partnering opportunities, or discuss potential collaborations.