



Assess Drug Penetration and Distribution
Measure therapeutic transport through 3D tumor tissue
Reveal the barriers that shape therapeutic penetration.
A drug can only act on the cells it reaches. In solid tumors, dense stroma and ECM, high interstitial pressure, and binding at the tumor periphery can leave the tumor core under-exposed, which can contribute to incomplete responses and regrowth. These barriers are largely missing from 2D culture, where every cell sees the same drug concentration, and they are hard to resolve at the cellular scale in animals. In the TME-Chip, labeled agents are perfused through 3D tumor tissue in a tunable matrix, so how far, how fast, and how evenly they penetrate can be measured by imaging.
Intratumoral Distribution of Antibodies and ADCs
Visualize the penetration depth and spatial distribution of large-molecule therapeutics within tumor tissue.
Antibodies and antibody–drug conjugates (ADCs) are especially affected by delivery barriers because of their size and, for high-affinity binders, their tendency to bind the first antigen-positive cells they meet. Fluorescently labeled antibodies or ADCs perfused through the TME-Chip can be imaged at defined time points to compare penetration depth and spatial distribution across candidates, formats, affinities, or doses. ECM composition and density can be varied to model different tumor microenvironments, such as the dense, fibrotic stroma of pancreatic cancer.
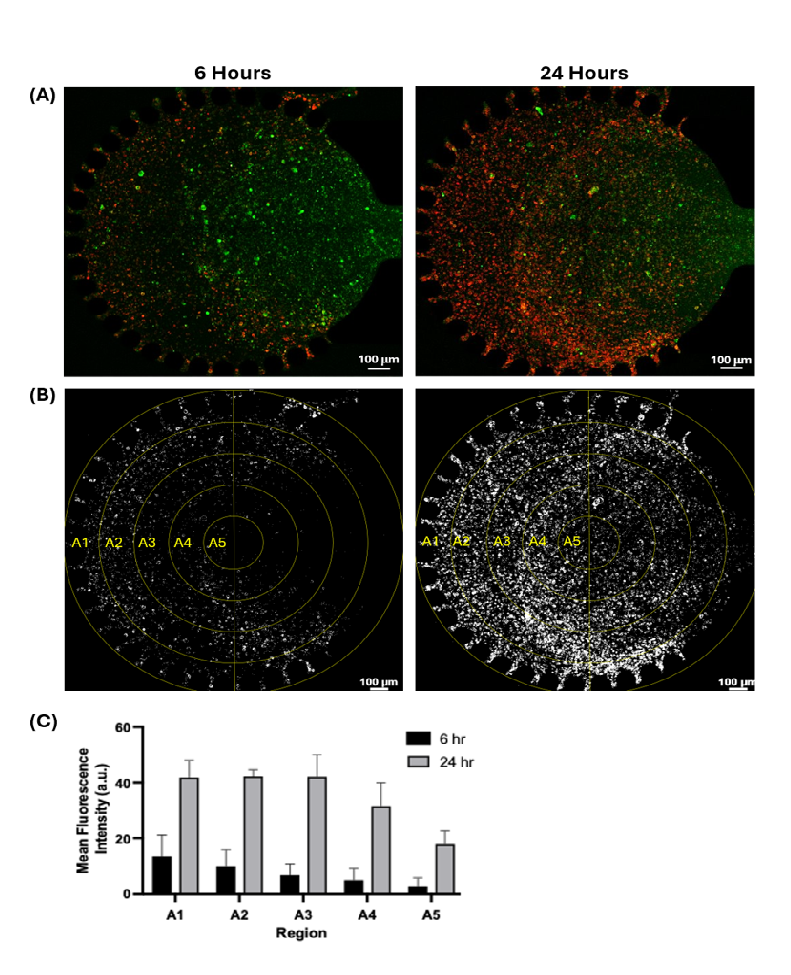
Antibody penetration into HER2-positive 3D tumor tissue over time on the TME-Chip.
(A) HER2-positive N87 gastric cancer cells expressing GFP (green), cultured as 3D tumor tissue on the TME-Chip and perfused with a fluorescently labeled anti-HER2 antibody (red) for 6 h (left) and 24 h (right). (B) Antibody channel from (A), with the five concentric regions used for quantification. Each ring is 190 µm wide, and the rings are numbered from the tissue periphery (A1) to the center (A5). Only the left half of each ring was analyzed. (C) Mean fluorescence intensity (MFI) of antibody signal in each region, normalized to region area. At 6 h, signal was sparse and concentrated on the tissue periphery. By 24 h, signal had increased in every region and reached further into the tissue, with similar levels across A1–A3 (up to 570 µm from the edge) and lower levels toward the core (A4–A5). Averaged across the five regions, MFI was about 4.7-fold higher at 24 h than at 6 h. The increase was smallest at the periphery (about 3-fold in A1) and larger toward the center (about 6- to 7-fold in A3–A5). Data are mean ± SEM; n = 3 chambers. Scale bars, 100 µm.
Drug Transport and Exposure Profiling
Follow what tumor tissue is exposed to over the course of treatment.
Under perfusion, effluent is collected at defined time points and analyzed for drug concentrations or tumor-derived factors. Combined with tissue imaging, this can provide a time-resolved view of drug exposure in the model and can be used to plan dosing schedules for efficacy studies.
Contact Us
Connect with Pythia Biotech to learn more about our products and services,
explore partnering opportunities, or discuss potential collaborations.